You have /5 articles left.
Sign up for a free account or log in.
The number of international students at American colleges and universities grew by 7.1 percent, to top one million in the 2015-16 academic year, according to the annual Open Doors report released today by the Institute of International Education and produced with funding from the U.S. Department of State.
The report, released amid concerns that the election of Donald Trump to the presidency could negatively impact future enrollments from abroad, records 10 straight years of growth in the number of international students on U.S. campuses. The overall growth picture is positive from the perspective of U.S. higher education, but the report includes a mix of positive and negative signs for the future. First-time enrollments of international students increased by 2.4 percent in fall 2015 over the previous year -- a positive sign -- but enrollments in intensive English programs, a common starting point for international students who ultimately want to pursue degree-level study, fell by 14.6 percent.
Meanwhile, the number of American students studying abroad for academic credit continues to increase, growing by 2.9 percent in the 2014-15 academic year to a grand total of 313,415. IIE estimates that about 10 percent of all American undergraduates, and about 15 percent of those studying for bachelor’s (as opposed to associate) degrees study abroad at some point during their program.
International Students in the U.S.
China remains the largest sender of international students to the U.S., with students from the country accounting for 31.5 percent of all international enrollments. The number of Chinese students at U.S. campuses grew by 8.1 percent in 2015-16 over the previous year, while the number of students from India, the country that sends the second-largest group, continues to grow even more rapidly. The total number of Indian students on U.S. campuses grew by 24.9 percent in 2015-16, following on a 29.4 percent growth rate the year prior and a 6.1 percent growth rate the year before that.
Saudi Arabia replaced South Korea as the third-largest country of origin, though the increase in the number of Saudi students, up 2.2 percent, represents a slower rate of growth than that seen in recent years (more on Saudi Arabia below). The number of students from the fourth-highest-sending country, South Korea, declined by 4.2 percent, representing the fifth straight year of declines in this student population.
Another notable change was a 18.2 percent decline in the number of students from the No. 8-sending country (and the No. 6 last year) Brazil, a drop largely attributable to the suspension of the Brazilian government’s large-scale Science Without Borders overseas scholarship program.
International Enrollments by Top Countries of Origin, 2015-16
| Country of Origin | Total Number of International Students | Percent Change From 2014-15 |
| World Total | 1,043,839 | +7.1 |
| 1. China | 328,547 | +8.1 |
| 2. India | 165,918 | +24.9 |
| 3. Saudi Arabia | 61,287 | +2.2 |
| 4. South Korea | 61,007 | -4.2 |
| 5. Canada | 26,973 | -1 |
| 6. Vietnam | 21,403 | +14.3 |
| 7. Taiwan | 21,127 | +0.6 |
| 8. Brazil | 19,370 | -18.2 |
| 9. Japan | 19,060 | 0 |
| 10. Mexico | 16,733 | -1.9 |
| 11. Iran | 12,269 | +8.2 |
| 12. United Kingdom | 11,599 | +8 |
| 13. Turkey | 10,691 | -0.3 |
| 14. Nigeria | 10,674 | +12.4 |
| 15. Germany | 10,145 | -0.5 |
Drilling down into enrollment trends by degree level, the number of international students increased at both the undergraduate and graduate levels, by 7.1 and 6 percent, respectively. But the growth was most striking at the “optional practical training” level -- OPT being a program in which students who have already graduated from their programs in the U.S. remain on their universities’ sponsorship while they work for a U.S. employer. The number of international students on OPT increased by 22.6 percent in the 2015-16 academic year.
The Obama administration recently issued a new rule extending the period for which students in science, technology, engineering and mathematics fields can work on OPT after graduation, from 29 to 36 months. That change in itself would expand the pool of OPT students by virtue of the fact that students could stay in the program longer, but the impact of the new rule, which became effective in May, would not be reflected in the newly released Open Doors data, which is based on enrollments from last fall.
At the same time there was growth at all other academic levels, the number of international students at the nondegree level fell by 9.1 percent. This includes a 14.6 percent drop in enrollments in universities’ intensive English programs, and a 3.7 percent drop in the number of international students enrolled in other nondegree programs.
Much of this drop in non-degree-seeking international students is attributable to the suspension of the Brazilian government scholarship program. Cheryl Delk-Le Good, the executive director of EnglishUSA, an association that includes both university-governed and independent, proprietary intensive English programs in its membership -- many of which are located on U.S. campuses or have formal admission arrangements with them -- said that the declines in intensive English enrollments reported in the Open Doors report for 2015 seem to be continuing into this fall. The association’s own polling of its members has found that, of 126 responding programs, 74 percent are experiencing enrollment declines this current fall compared to last fall. Delk-Le Good said the declines are largely due to drops in both Brazilian and Saudi students.
Many U.S. colleges have reported substantial declines in the number of new Saudi students coming to their campuses this fall after years of dramatic growth in this population. The Saudi government has made a number of changes to what’s been a massive foreign scholarship program, including the introduction of much stricter academic eligibility requirements for the subset of students who self-fund their initial English or degree-level studies and apply to join the scholarship program after coming to the U.S. (entering through what’s colloquially called the “back door” into the program, as opposed to going through the “front door,” which would be to apply for scholarship funding from within Saudi Arabia). According to changes reported in the state-run Saudi Press Agency in February, only those students who gain entry to top 100 universities, or top 50 programs, according to lists maintained by the government, are now eligible to be added to the scholarship program through the back-door route.
But an official at the Saudi Ministry of Education stressed the government’s continuing commitment to the foreign scholarship program, which is being reshaped through an initiative to link scholarship awards to job offers (the initiative is called Your Job, Your Scholarship). Salim Al Malik, an adviser and general director for international affairs at Saudi Arabia’s Ministry of Education, said the ministry has planned for 10,000 new foreign scholarships this year, half of which are in medical or allied medical fields, another 30 percent of which are in STEM-related fields, and 13 percent of which are in aviation, with other scholarships available in finance, law and other fields.
Asked whether the decline in nondegree program enrollments points to a forthcoming decline in overall international student numbers, Rajika Bhandari, IIE’s deputy vice president, said no.
“I don’t believe it heralds a decline, because if you look at the overall makeup of nondegree students within the total enrolled international students, that number’s pretty low: it’s only 85,000 after the decline we’ve seen this year. I think any ebbs and flows that we see in this category in the near future are not likely going to move the needle on the overall numbers, because if you look at the size of enrollment at the undergraduate level and the graduate level, those numbers are just huge compared to the nondegree category,” she said.
International Students in the U.S. by Academic Level, 2015-16
| Academic Level | Number of International Students | Percent of Total | Percent Change From 2014-15 |
| Total Undergraduate | 427,313 | 40.9 | +7.1 |
| Associate | 78,297 | 7.5 | +12.6 |
| Bachelor's | 349,016 | 33.4 | +6 |
| Total Graduate | 383,935 | 36.8 | +6 |
| Master's | 233,463 | 22.4 | +12.1 |
| Doctoral | 122,655 | 11.8 | +3.9 |
| Professional | 12,742 | 1.2 | +24.7 |
| Unspecified | 15,075 | 1.4 | -41 |
| Total Nondegree | 85,093 | 8.2 | -9.1 |
| Intensive English | 39,444 | 3.8 | -14.6 |
| Other | 45,649 | 4.4 | -3.7 |
| Optional Practical Training | 147,498 | 14.1 | +22.6 |
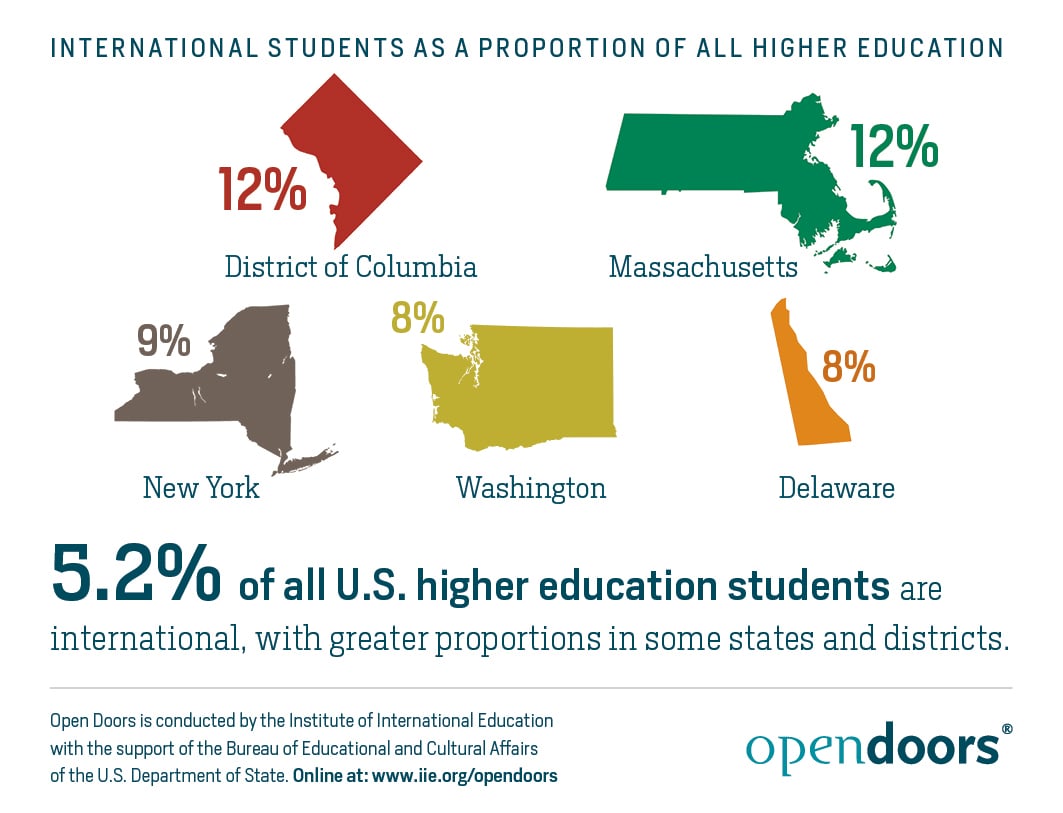
IIE estimates that international students made up 5.2 percent of all students in U.S. higher education in 2015-16, an increase from 4.8 percent the year before and 3.2 percent a decade earlier. The proportions of international students in some states are higher, per the infographic below from IIE.
Eight institutions enroll more than 10,000 international students. These institutions, in descending order of international enrollment, are New York University, the University of Southern California, Arizona State University, Columbia University, the University of Illinois at Urbana-Champaign, Northeastern University, the University of California, Los Angeles, and Purdue University.
American Students Abroad
As for study abroad, the number of American students participating continues to steadily increase: more than 100,000 more students studied abroad in 2014-15 than did a decade earlier -- 313,415 total students in 2014-15 versus 205,983 in 2004-05. But as participation has increased, the average duration of study abroad programs has shrunk, with about 63.1 percent of Americans studying abroad in 2014-15 doing so on summer or short-term programs defined as eight weeks or fewer. This compares to the 51.2 percent of study abroad students who chose summer or short-term programs 10 years earlier.
Proportion of Study Abroad Students by Duration of Program Over Time***
| 2004-5 | 2010-11 | 2014-15 | |
| Summer | 37.2% | 37.7% | 39% |
| Summer: more than 8 weeks | -- | -- | 2.7% |
| Summer: 2-8 weeks | -- | 34.4% | 30.9% |
| Summer: fewer than 2 weeks | -- | 3.3% | 5.4% |
| One Semester | 37.5% | 34.5% | 31.8% |
| 8 weeks or fewer during the academic year | 8% | 13.3% | 16.7% |
| 2-8 weeks during the academic year | -- | 5% | 6.5% |
| Fewer than 2 weeks during the academic year | -- | 8.3% | 10.2% |
| January term | 6% | 7.1% | 7.4% |
| Academic year | 6% | 3.7% | 2.5% |
| One quarter | 3.3% | 3% | 2.2% |
| Two quarters | 1.3% | 0.5% | 0.3% |
| Calendar year | 0.2% | 0.1% | 0.1% |
| Other | 0.5% | 0.1% | 0.1% |
***Dashes indicate categories for which IIE did not collect data in the respective year.
“Debate has existed: Should students go abroad for a longer, more immersive experience, or is it more important to send a larger number of students overseas, albeit for a shorter period of time?” said IIE’s Bhandari. “I think that both arguments have their merits. What I would say is being able to go abroad for shorter periods of time has enabled many U.S. students to have that opportunity to go abroad, including students in STEM fields, including students at community colleges.”
The largest numbers of students going abroad are majoring in STEM fields, with business majors making up the second-largest group. The population of students studying abroad, which has been disproportionately white, is slowly growing more diverse. About 27 percent of Americans studying abroad identified as a member of a racial minority group in 2014-15, up from 17 percent in 2004-05. Just about two-thirds of Americans studying abroad -- 66.6 percent -- are women.
Total Number of U.S. Study Abroad Students by Top Five Fields of Study, 2014-15
| Major Field of Study | Number of Students |
| STEM | 75,065 |
| Business | 63,015 |
| Social Sciences | 54,295 |
| Foreign Language and International Studies | 24,077 |
| Fine and Applied Arts | 21,693 |
Europe is the destination of choice for more than half (54.5 percent) of students studying abroad. The five most popular countries for U.S. study abroad in are, in order, the United Kingdom, Italy, France, Spain and China.
Notably, the number of students going to China dropped for the third year in a row, falling by 7.1 percent in 2014-15 over the year before, and following on declines of 4.5 percent and 3.2 percent in the two years before that. These declines come despite President Obama’s 100,000 Strong initiative, launched in 2009, to try to get more students to go to China.
U.S. Study Abroad by Top Destination Countries, 2014-15
| Total Number of U.S. Students Studying Abroad | Percent Change From 2013-14 | |
| World Total | 313,415 | +2.9 |
| 1. United Kingdom | 38,189 | -0.2 |
| 2. Italy | 33,768 | +8.3 |
| 3. Spain | 28,325 | +5.1 |
| 4. France | 18,198 | +3.4 |
| 5. China | 12,790 | -7.1 |
| 6. Germany | 11,010 | +6.1 |
| 7. Ireland | 10,230 | +15.9 |
| 8. Costa Rica | 9,305 | +8.5 |
| 9. Australia | 8,810 | +5.3 |
| 10. Japan | 6,053 | +1.3 |
| 11. South Africa | 5,249 | +5.7 |
| 12. Mexico | 4,712 | +6 |
| 13. India | 4,438 | -3.2 |
| 14. Czech Republic | 4,093 | +14.6 |
| 15. Denmark | 4,034 | +13.8 |
“We are worried about the declining numbers, and U.S. institutions, I think, are eager to keep having their students study in China,” said Peggy Blumenthal, the senior counselor to the president at IIE. “But that being said, many universities have kind of a rotating program where they might send students to one Asian country one year and then to another another year. Some of them have reported when we asked about this decline, saying, ‘Well, this year it’s Japan, next year it’s Thailand’ -- they don’t have a large enough number of students from any given institution that they can send out every year to all countries.”
“But our impression also -- and this is strictly anecdotal -- that some of the coverage in the newspapers about the pollution in major cities in China, some of the health and food security concerns, might be affecting parents and students when they’re thinking about where to spend a summer abroad,” Blumenthal continued.
“From the State Department’s perspective, of course, this is of concern and we would like those numbers to be higher,” said Evan M. Ryan, the assistant secretary of state for educational and cultural affairs. “We also think it’s possible that U.S. universities are having more difficulty in navigating the bureaucracy in China, in setting up exchange programs, setting up academic ties. Our relationship with China is complex, and complex related to the issues concerning human rights and academic freedom. We know that it’s important for Americans to have that experience and be able to study in China, to be able to learn Mandarin, but there are obviously concerns and … some of these concerns might reside with parents as well.”
IIE has also begun collecting data on the number of students going abroad for noncredit work, internship or volunteer activities. Not all institutions report on this, but the 373 that did collectively reported that more than 22,000 of their students went abroad for these types of noncredit activities in 2014-15, with Latin America and the Caribbean being the most popular destination for noncredit travel.


